One of the greatest challenges in analysing Private Equity performance is understanding where the returns actually came from. This understanding can be extremely useful in both assessing fund managers’ ability to add value and to benchmark a fund’s returns against its peers and the market. Luckily, there is fairly straightforward way to do this. Shoutout to my colleagues at EBRD for looking into this and for pointing me in the right direction.
First , we need to have a firm grasp over what we are trying to measure. Let’s start from the basics.
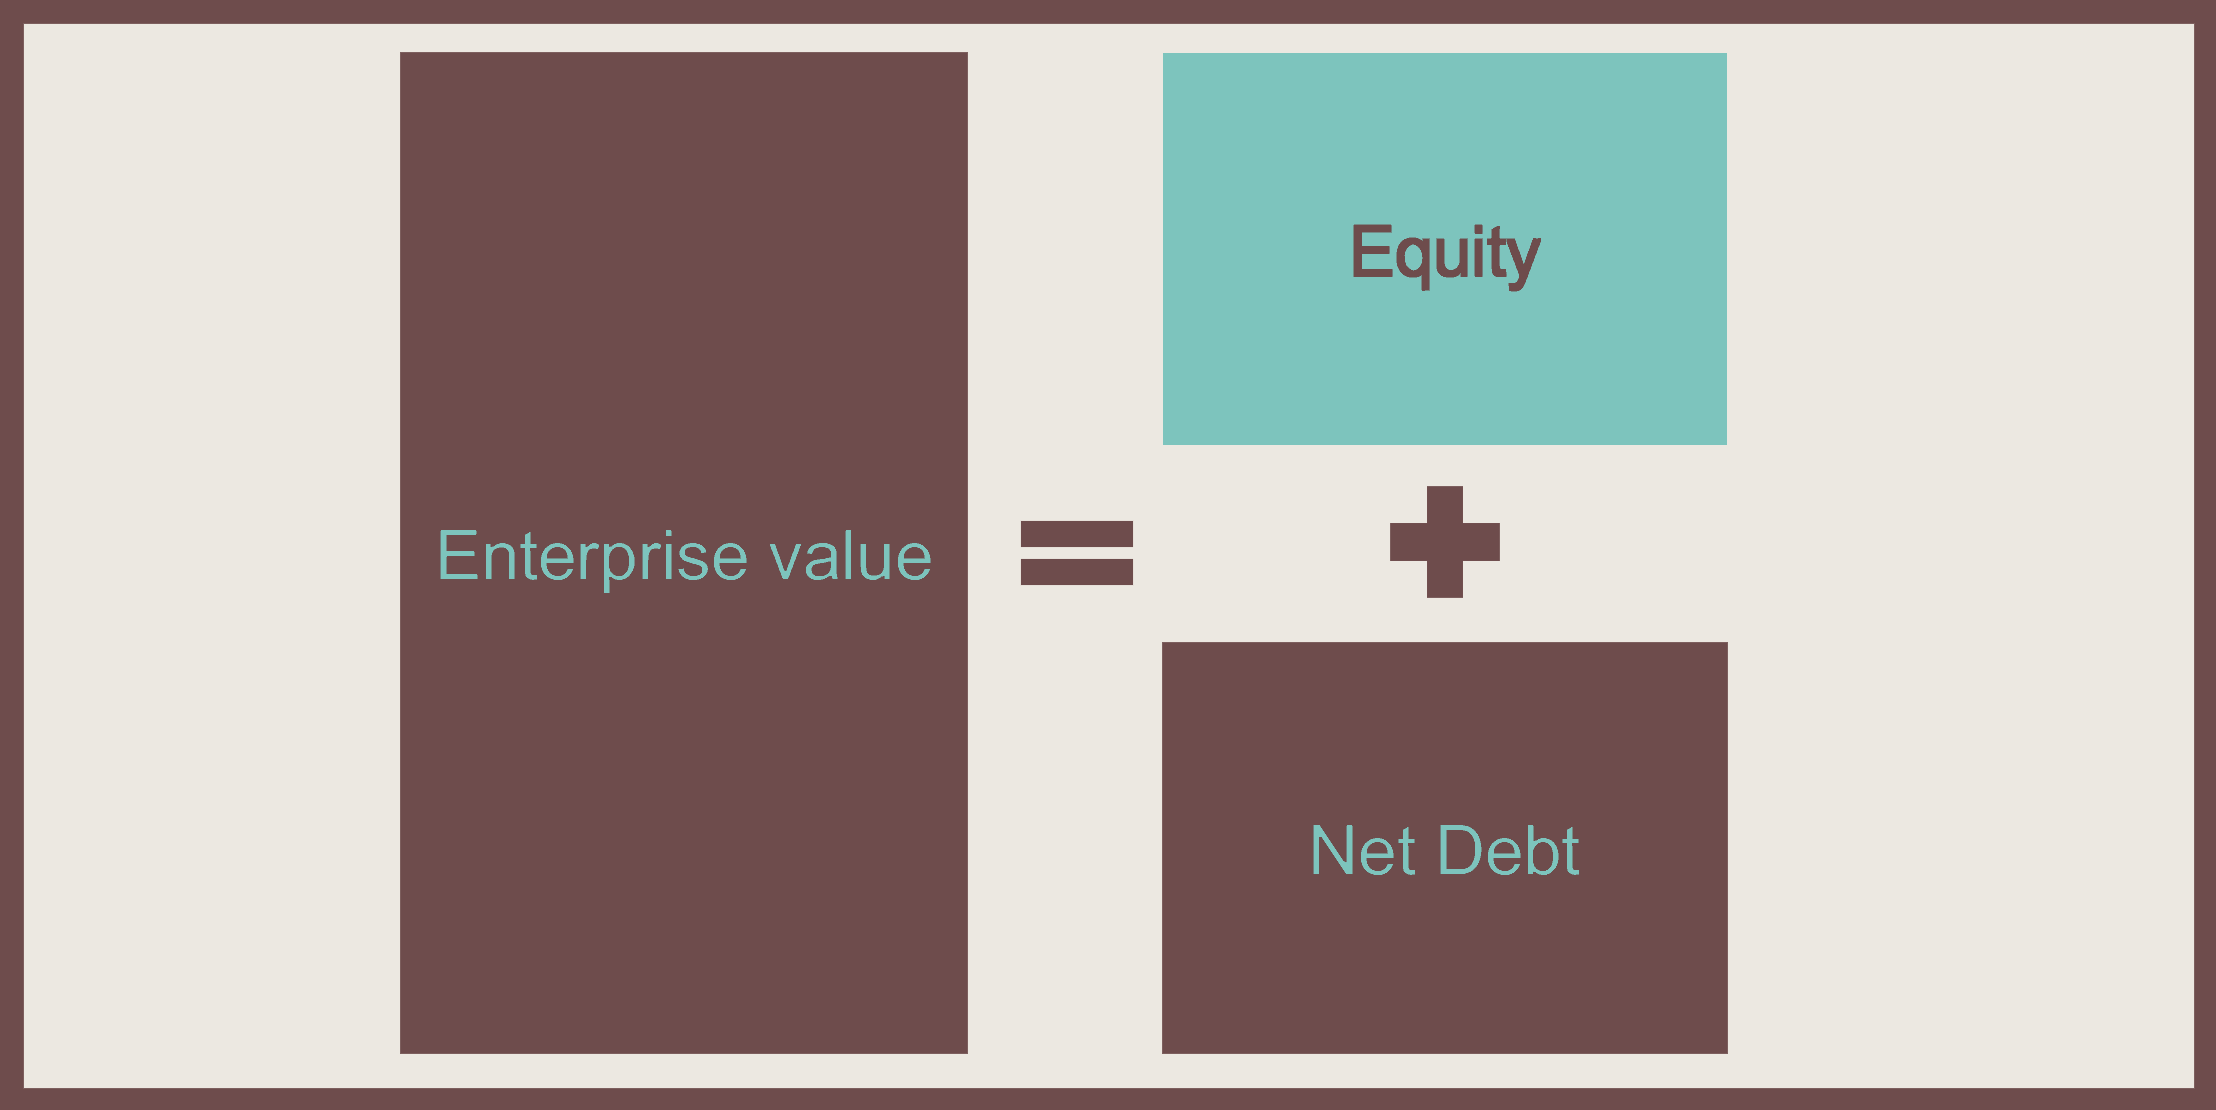
If we are interested in assessing how Fund Managers perform, we should focus on Equity and, in particular, on how fund managers are able to increase its value during their ownership of a company. We know that Enterprise value is made up of two components: Equity and Net debt, that is, debt minus cash. Consequently, Equity will be Enterprise value – Net Debt.
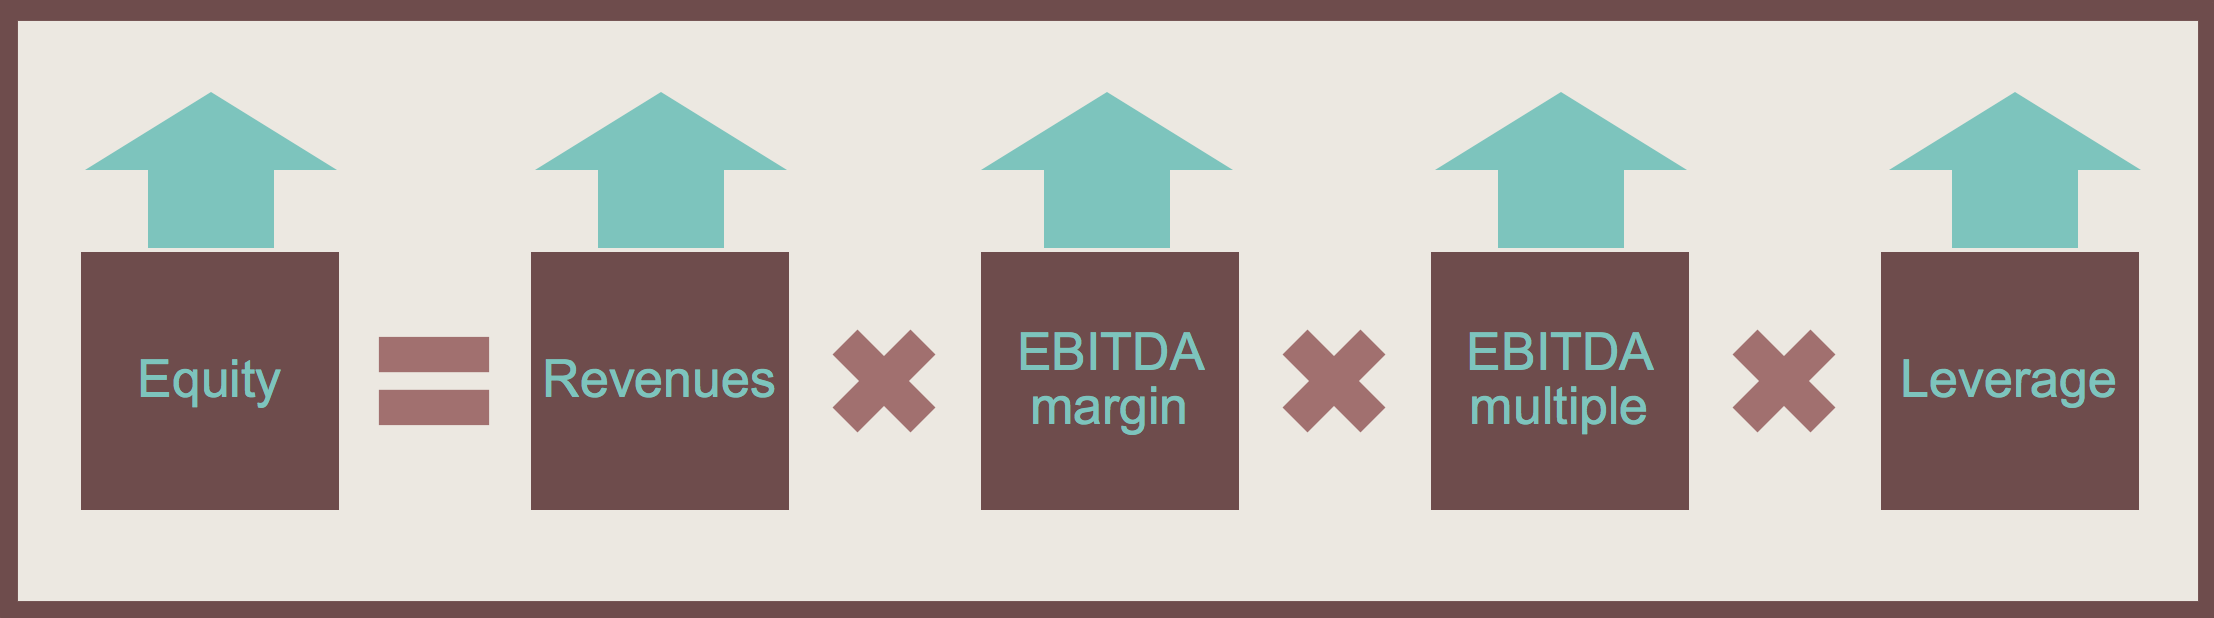
We can also see Equity as made of the following components: revenues, EBITDA margin, EBITDA multiple and a measure of leverage. Or for the more mathematically inclined:

If we are interested in knowing how fund managers are increasing the value of equity, we can assess the change by looking at the growth in these components.

And since we are interested in breaking down the growth rate in the equity, we divide everything by (1 + CAGR(Equity)) to get:

As we are interested in breaking the IRR down, we can take the log of both sides and using the log property logb(x ∙ y) = logb(x) + logb(y), we get:

We need then to scale the growth to IRR, so we multiply both sides by IRR and we get:
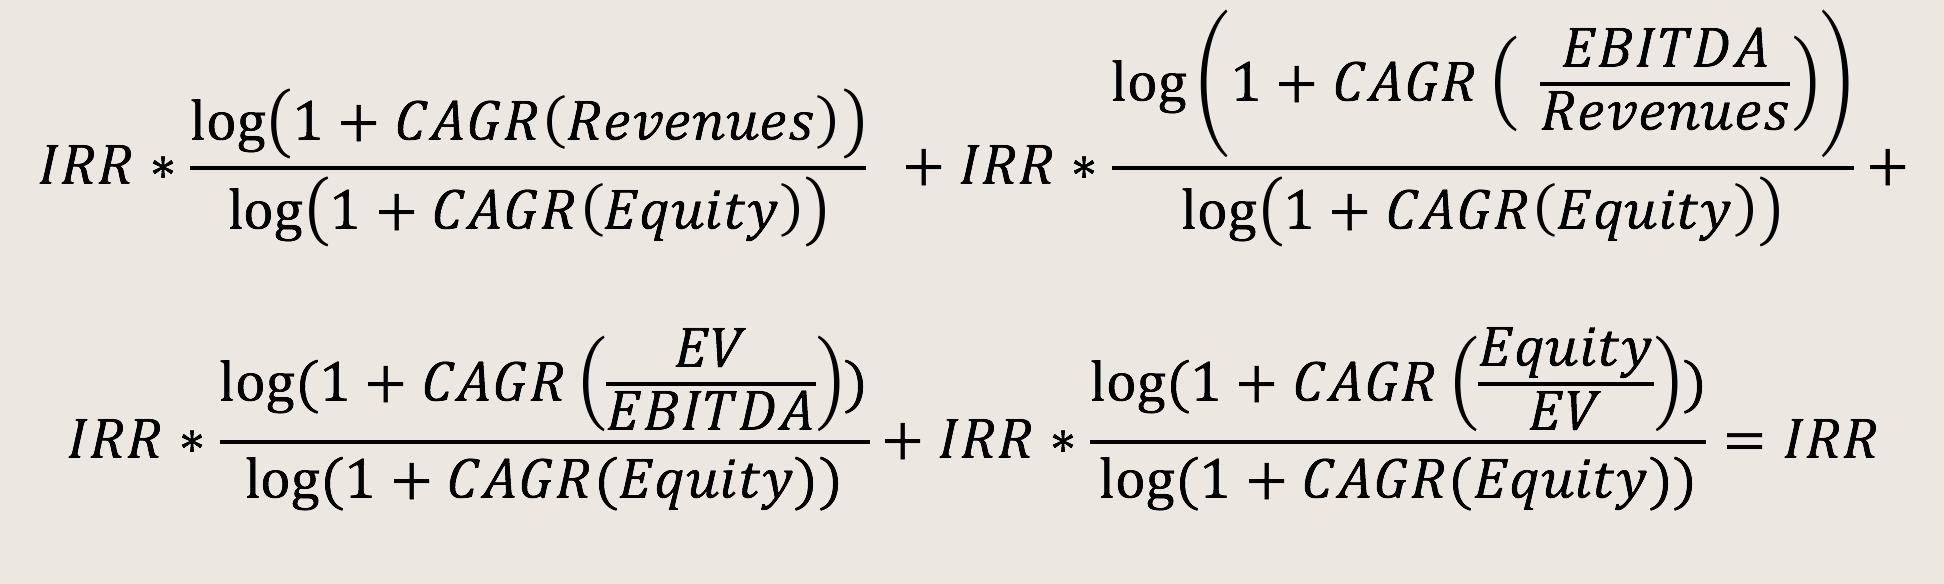
Which looks like a scary formula, but which in reality is not that bad.
Now that we have the theory down, we simply need to gather the ingredients and set up a nice spreadsheet to do all the “dirty” work for us.The only things we need are:
- Revenues at entry and exit
- Equity at entry and exit
- EBITDA at entry and exit
- Net debt at entry and exit
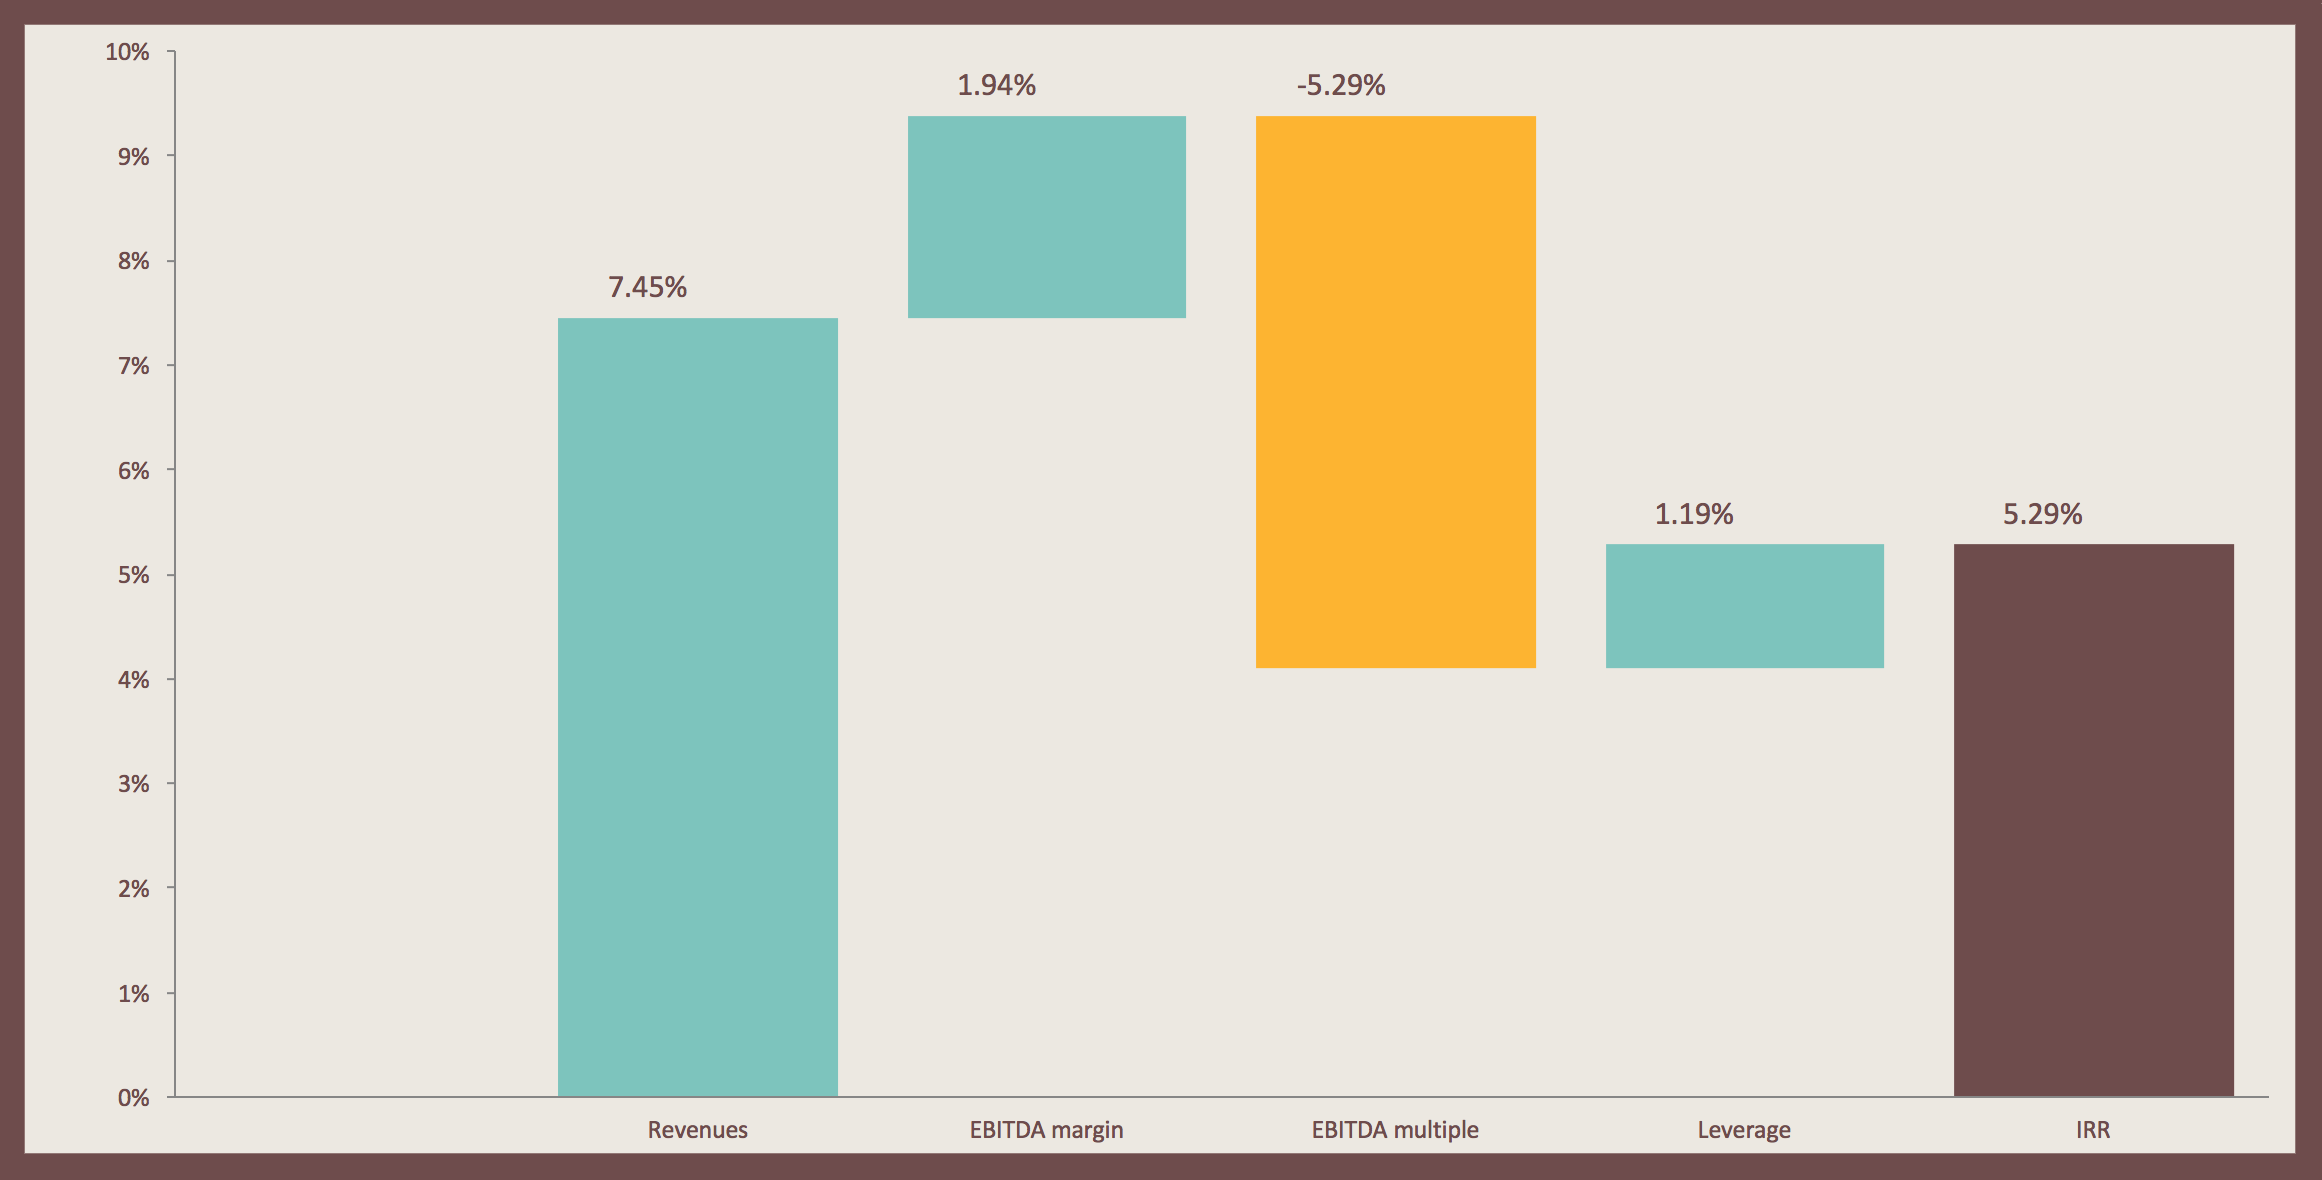
I have set up a simple spreadsheet with some sample data to play around (which you can download here if you so wish). This breakdown makes it very simple to visualize IRR components, especially if you enlist the help of a handy waterfall chart.

Hi there, great article. would you be able to reupload the spreadsheet? The link does not appear to work. many thanks!
Updated 🙂 Thank you for reading!
This is extremely helpful. Could you please reupload the file for reference? Thank you!
Updated. Glad this is helpful, even after all these years 🙂